Visualization 1: Violin Plots
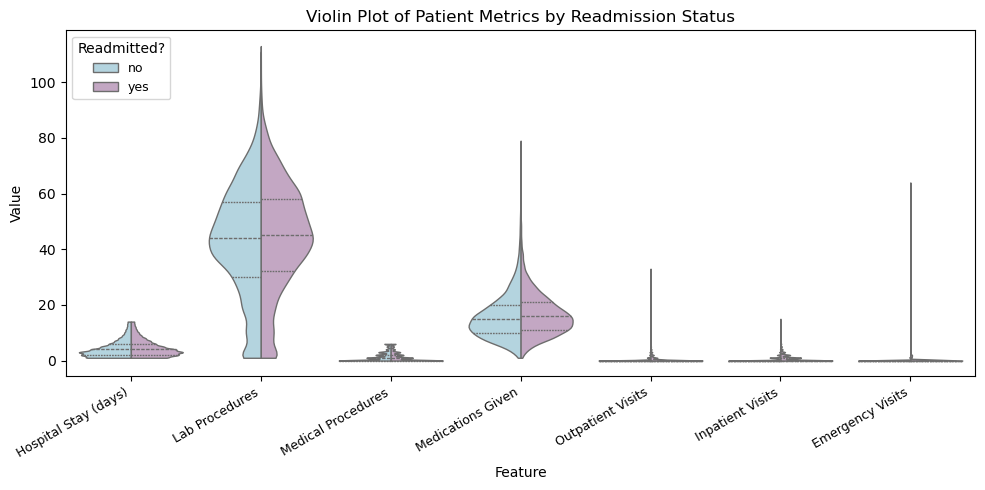
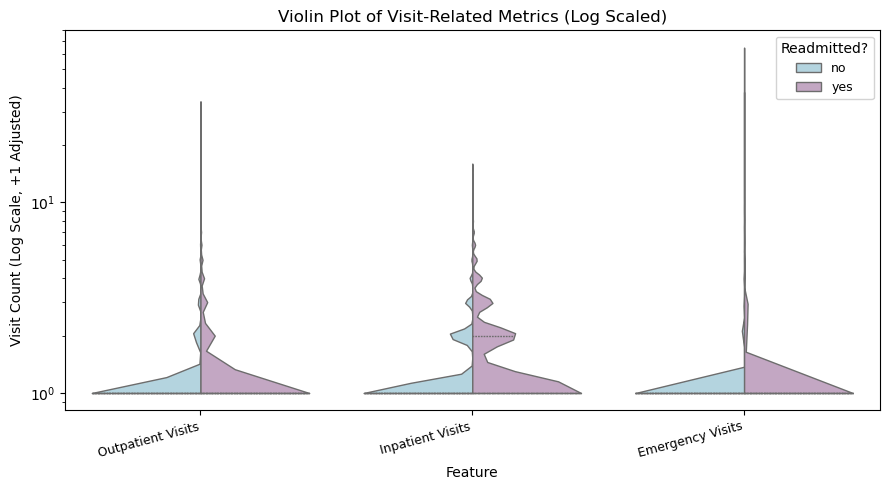
Key Finding: The full violin plot shows that most hospital-related measurements in the dataset are highly right skewed, meaning the majority of patients use only a small amount of medical resources while a smaller subset requires substantially more, with readmitted patients appearing more frequently in those higher-value ranges. Because three of the variables (outpatient, inpatient, and emergency visits) operate on a much smaller scale and were visually compressed in the full plot, a separate log-scaled violin chart was created, revealing more detailed variation and showing that patients with higher visit frequency, especially before hospitalization, are more likely to be readmitted, suggesting prior care utilization may be an early indicator of clinical instability.
Visualization 2: Ridgeline Plot of Hospital Metrics
Key Finding: The ridgeline plot provides a high-level view of how each hospital utilization metric is distributed across the patient population. Most features show a strong right-skew, meaning that while the majority of patients use relatively few medical resources, a smaller subset requires significantly more care. This suggests the presence of a high-need patient group, which may be especially important when analyzing risk factors for rehospitalization and designing targeted interventions.
Visualization 3: Average Procedures During Hospital Stay by Age
Key Finding: This multi-linear chart contains each line as different age groups, its X-axis as time in hospital (Days), and its Y-axis as the average number of procedures done for each age group for the amount of time they stay in the hospial. The chart contains interactive elements including a selectable age range legend that will allow users to see each line alone as well as a hover tooltip that will show age range, time in hospital, and average procedures done of each data point. As the time in hospital increases, the amount of lab procedures done starts to gradually increase with patients in the age range of 90-100 having dramatic drops in the average number of procedure done. This may indicate patients in this age group typically leave the hospital after a certain time or they may have passed away. Moreover, starting on the first day, patients in age group 90-100 has a higher number of procedures done than any other groups. Patients in the youngest age groupp 40-50 typically have fewer number of procedures done on average.
Visualization 4: Exploring Age-Related Disease Patterns in Hospital Admissions
Key Finding: This grouped bar chart reveals how different diagnoses are distributed across age groups, with circulatory conditions showing the highest frequency at nearly 2,400 cases in the 70-80 age range. The data demonstrates clear age-related disease patterns, with both circulatory and respiratory conditions showing pronounced increases in elderly populations. Diabetes-related admissions maintain relatively consistent levels across the 40-80 age range, indicating sustained chronic disease burden across multiple decades. Younger patients (under 50) represent a smaller proportion of admissions across all categories, while the 70-80 age bracket accounts for the overwhelming majority of hospital utilization. These patterns suggest healthcare systems should prioritize geriatric medicine resources and implement preventive care interventions for patients in their 60s before they enter the highest-risk age group.
Visualization 5: Exploring Readmission Rates by Medical Specialty
Key Finding: This horizontal bar chart identifies medical specialties with the greatest readmission challenges, showing Family/General Practice and Emergency/Trauma departments with rates approaching 50%, substantially above the hospital average of 47%. Cardiology and Internal Medicine demonstrate readmission rates at or slightly below average despite treating complex chronic conditions, suggesting more robust discharge protocols. Surgery and "Other" specialties show the lowest rates at approximately 41-42%, indicating benefits from standardized recovery protocols and clearer post-operative instructions. The 10-percentage-point variation between highest and lowest performing specialties represents significant opportunities for quality improvement through knowledge transfer. Specialties above the average line should prioritize interventions including dedicated care coordinators, enhanced patient education, and structured follow-up systems to reduce preventable readmissions.
Visualization 6: Parallel Coordinates Readmission
Key Finding: This parallel coordinates chart shows clear differences between patients who were readmitted and those who were not. Patients who were readmitted tend to have higher values across multiple measures, especially the number of medications and lab procedures. Their lines appear more concentrated in the upper ranges of the plot. This suggests that patients with more complex medical needs or heavier treatment plans are more likely to return to the hospital. In contrast, non-readmitted patients show lower and more stable values across most attributes. Overall, the chart highlights a strong link between treatment intensity and readmission risk.
Visualization 7: Readmission Rate Heatmap
Key Finding: This heatmap shows that readmission rates vary strongly across both diagnosis types and medical specialties. Some combinations stand out with higher rates, such as diabetes cases treated in cardiology or emergency departments. These areas appear in darker green. This suggests that certain patient groups may require closer follow-up or more targeted discharge planning. In contrast, specialties like surgery or family practice show lower readmission rates for many diagnoses. Overall, the heatmap highlights where readmission risk is concentrated and helps identify which diagnosis specialty pairs may benefit from additional support.
Visualization 8: Glucose Level Amongst Age Groups
Key Finding: From the stacked bar chart, it can be seen that most values in this dataset for glucose level is unavailable. However, through this stack bar chart's interactive selection legend, it can be seen that in the dataset, most patients that readmit into hospitals are patients in the age range of 70-80. This indicates that younger patients with diabeties is less likely to be readmitted into hospitals whereas older patients are more likely to as seen from the right skew of both the high glucose level selection and the normal level selection. This also indicates that diabetes may not be an indication of hospital readmission since the distribution of high glucose count is about the same as the normal glucose count distribution.
Summary of Findings
This project explores the factors associated with hospital readmissions using a dataset of 25,000 patient records from Kaggle. Through a series of interactive visualizations, we analyzed how patient characteristics, diagnoses, medical specialties, and hospital utilization patterns relate to the likelihood of being readmitted. The visualizations reveal clear trends: older age groups and patients with high medical resource usage—such as more medications, procedures, and lab tests—tend to have higher readmission rates. Certain diagnosis–specialty combinations, particularly diabetes and circulatory conditions treated in cardiology or emergency departments, show elevated risk. Together, these insights emphasize the importance of targeted follow-up care, improved discharge planning, and specialty-specific interventions to reduce preventable readmissions.